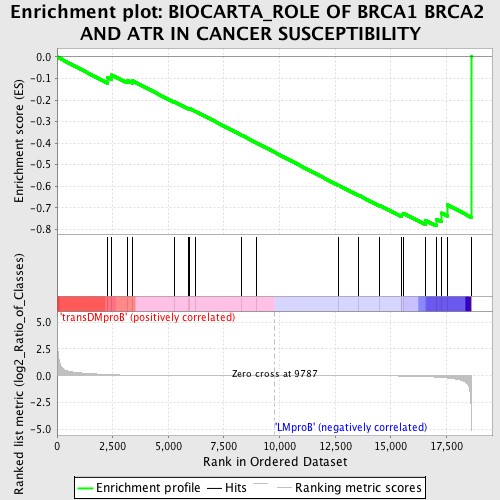
Profile of the Running ES Score & Positions of GeneSet Members on the Rank Ordered List
| Dataset | Set_04_transDMproB_versus_LMproB.phenotype_transDMproB_versus_LMproB.cls #transDMproB_versus_LMproB |
| Phenotype | phenotype_transDMproB_versus_LMproB.cls#transDMproB_versus_LMproB |
| Upregulated in class | LMproB |
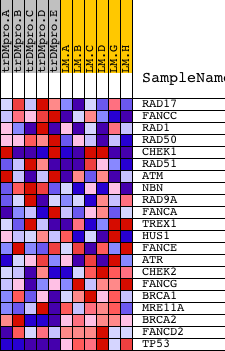
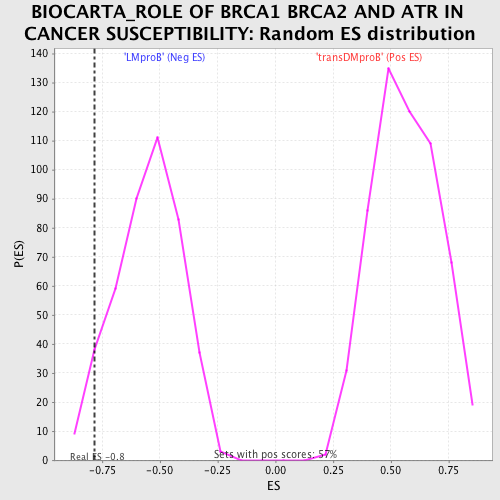
| GeneSet | BIOCARTA_ROLE OF BRCA1 BRCA2 AND ATR IN CANCER SUSCEPTIBILITY |
| Enrichment Score (ES) | -0.78421515 |
| Normalized Enrichment Score (NES) | -1.4302022 |
| Nominal p-value | 0.058139537 |
| FDR q-value | 1.0 |
| FWER p-Value | 1.0 |
| PROBE | DESCRIPTION (from dataset) | GENE SYMBOL | GENE_TITLE | RANK IN GENE LIST | RANK METRIC SCORE | RUNNING ES | CORE ENRICHMENT | |
|---|---|---|---|---|---|---|---|---|
| 1 | RAD17 | 21366 | 2266 | 0.106 | -0.0956 | No | ||
| 2 | FANCC | 4712 | 2460 | 0.090 | -0.0837 | No | ||
| 3 | RAD1 | 22507 | 3152 | 0.051 | -0.1083 | No | ||
| 4 | RAD50 | 1198 20460 | 3398 | 0.042 | -0.1110 | No | ||
| 5 | CHEK1 | 19181 3085 | 5275 | 0.013 | -0.2086 | No | ||
| 6 | RAD51 | 2897 14903 | 5895 | 0.010 | -0.2394 | No | ||
| 7 | ATM | 2976 19115 | 5945 | 0.010 | -0.2397 | No | ||
| 8 | NBN | 2485 16268 2408 | 6229 | 0.009 | -0.2528 | No | ||
| 9 | RAD9A | 913 3674 910 23958 | 8309 | 0.003 | -0.3639 | No | ||
| 10 | FANCA | 18717 | 8978 | 0.002 | -0.3994 | No | ||
| 11 | TREX1 | 10219 3111 | 12666 | -0.006 | -0.5962 | No | ||
| 12 | HUS1 | 9138 4890 | 13536 | -0.009 | -0.6407 | No | ||
| 13 | FANCE | 23318 | 14493 | -0.014 | -0.6886 | No | ||
| 14 | ATR | 19349 | 15481 | -0.028 | -0.7348 | No | ||
| 15 | CHEK2 | 16751 3587 | 15501 | -0.028 | -0.7290 | No | ||
| 16 | FANCG | 15904 | 15556 | -0.029 | -0.7246 | No | ||
| 17 | BRCA1 | 20213 | 16569 | -0.081 | -0.7590 | Yes | ||
| 18 | MRE11A | 3014 19560 | 17039 | -0.130 | -0.7522 | Yes | ||
| 19 | BRCA2 | 16612 | 17269 | -0.165 | -0.7239 | Yes | ||
| 20 | FANCD2 | 17326 464 | 17536 | -0.213 | -0.6858 | Yes | ||
| 21 | TP53 | 20822 | 18610 | -3.019 | 0.0003 | Yes |